Turtle Games: Customer Analytics Project
Overview:
As part of the
LSE Data Analytics Online Career Accelerator (Course 3:
Advanced Analytics for Organisational Impact), this project explored how
Turtle Games can use data to improve marketing, customer retention, and
decision-making. The goal was to understand loyalty patterns, segment
customer groups, and analyse sentiment from customer reviews.
I used R to conduct statistical analysis to understand data
distribution, and used Python to perform predictive modelling,
clustering, and Natural Language Processing (NLP). Datasets were drawn
from customer demographics, loyalty behaviour, and customers' reviews
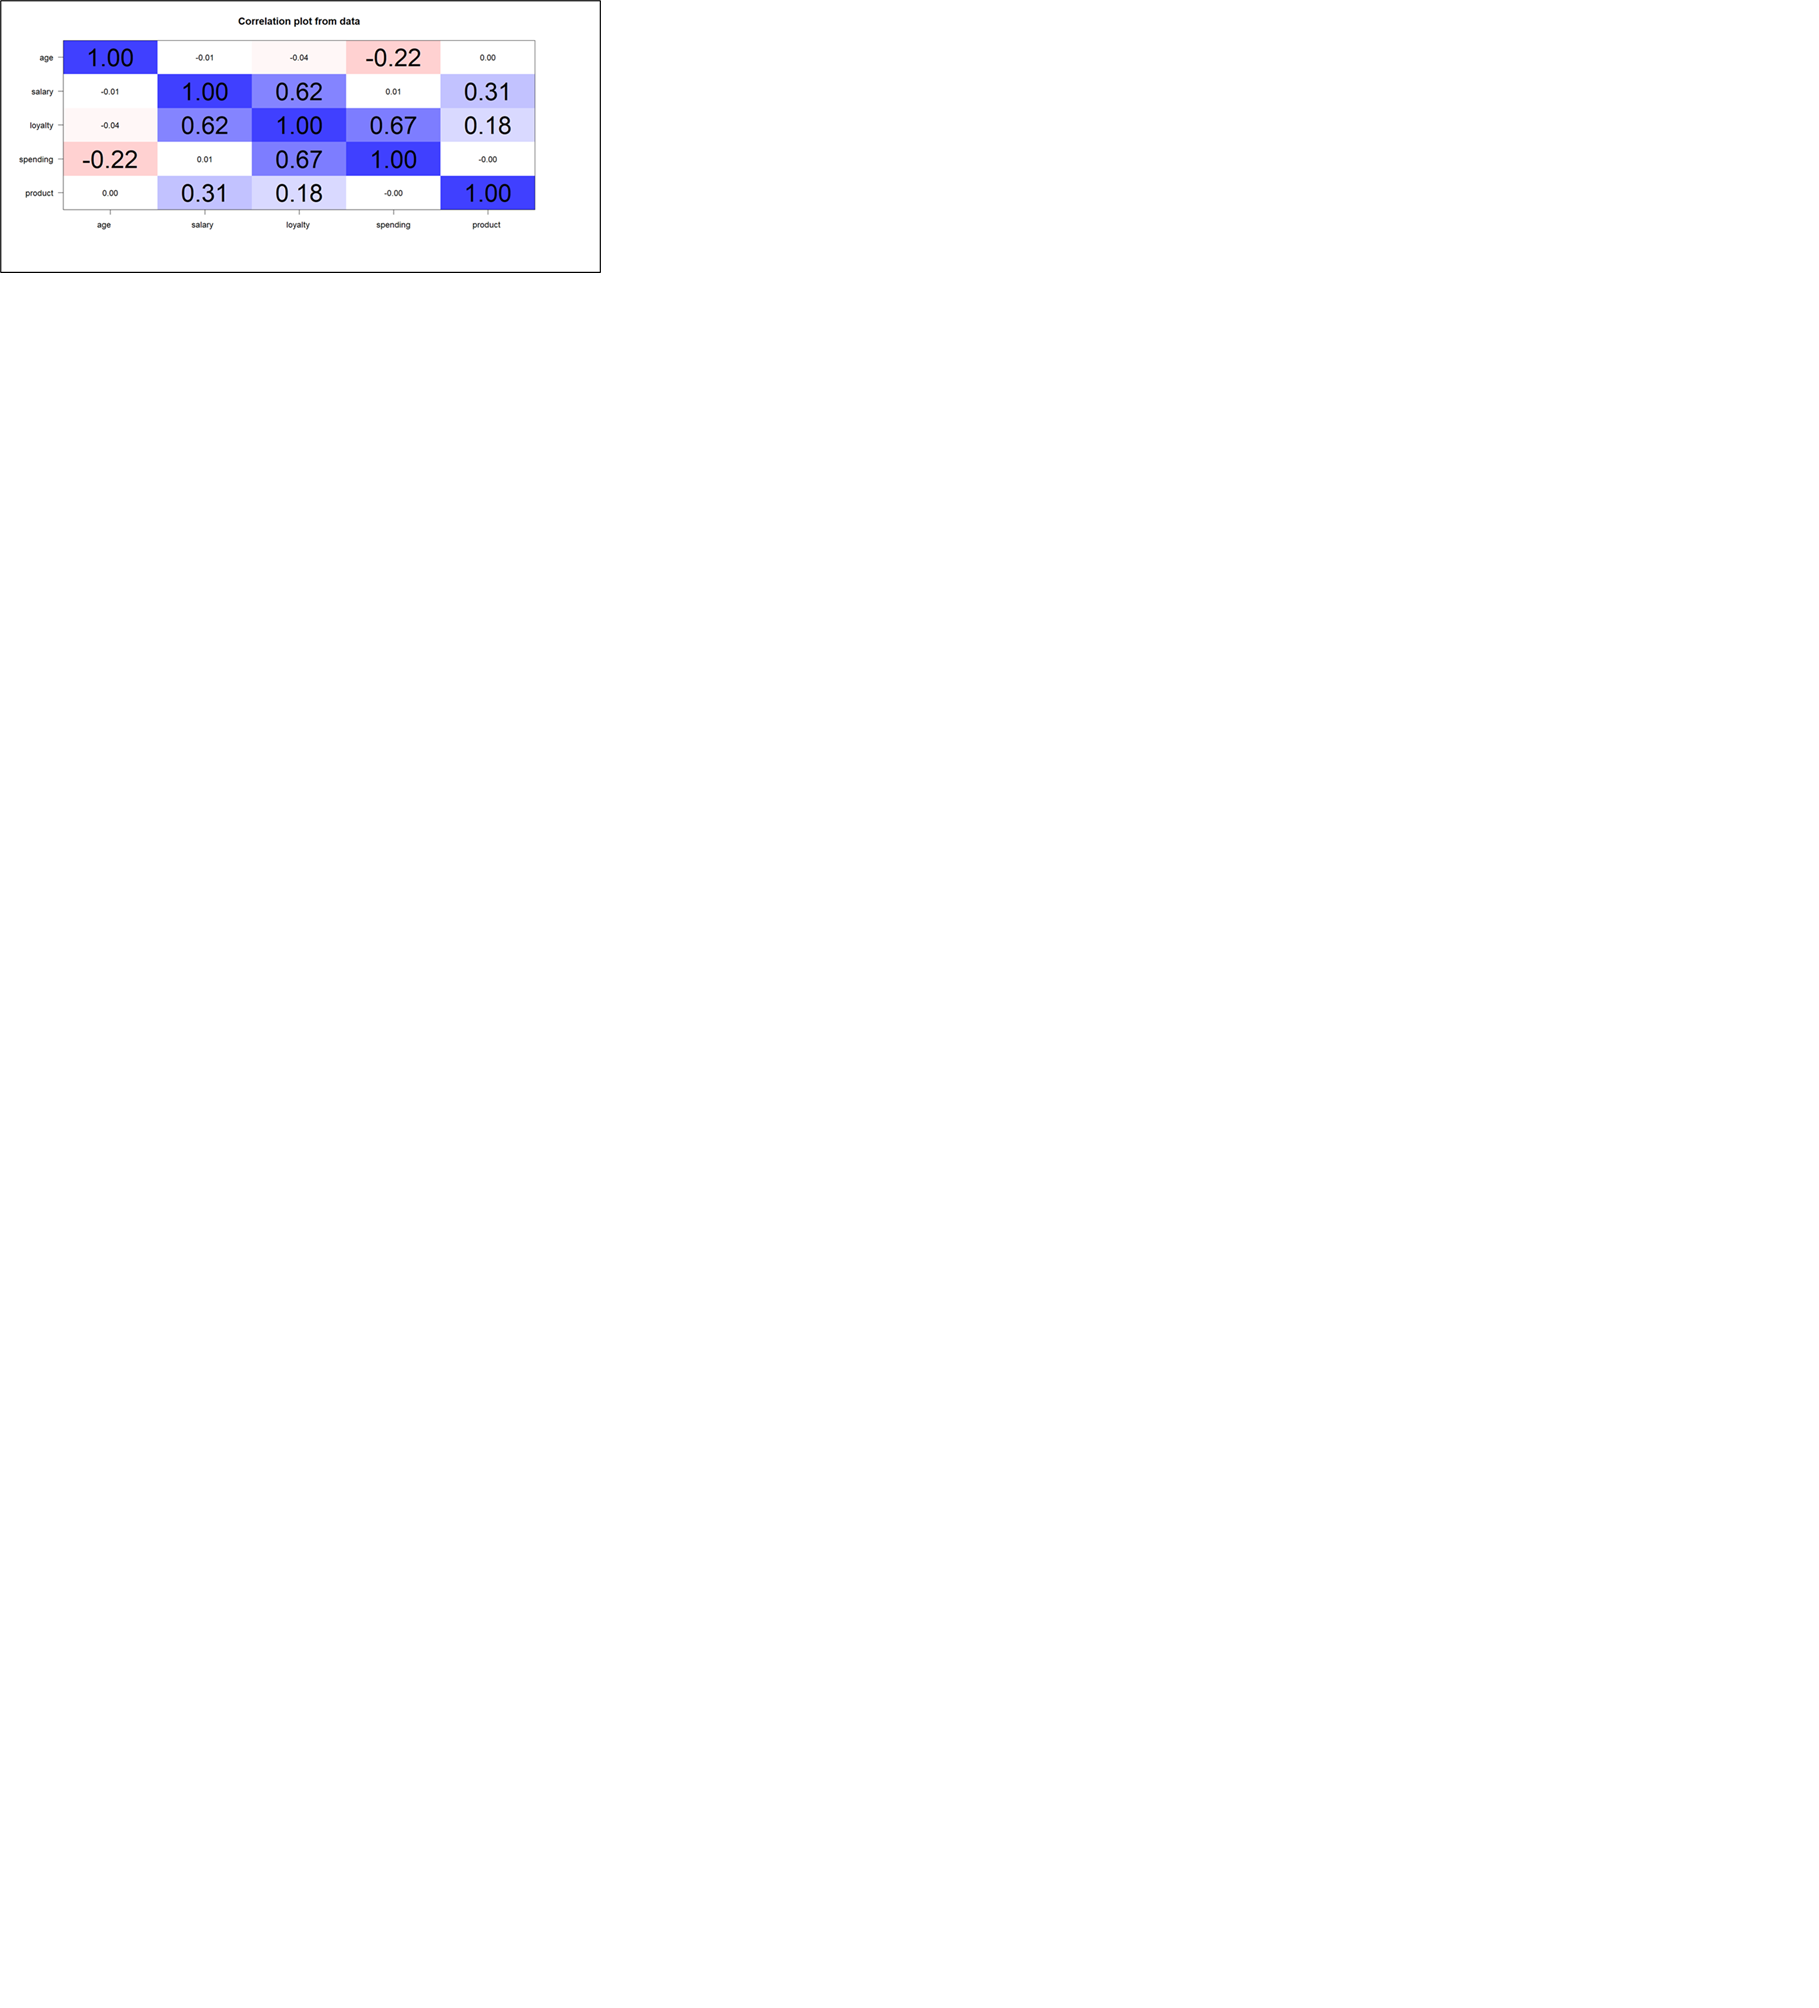
data. Prior to this, correlation analysis was used to explore
relationship between variables.
For the statistical analysis, I focused on:
- Predicting loyalty using salary, spending, age, and product interactions
- Building decision tree models to identify high-impact loyalty drivers
- Clustering customers into actionable market segments using K-Means
- Performing sentiment analysis on customers' review data using NLP
Based on the observations and insights, I was able to make the following recommendations:
- Target high-income, high-spending customers for premium loyalty programs
- Focus marketing on ages 32–34, the most loyal age group
- Engage low-spending, high-income customers with discounts or incentives
- Track product purchase frequency in future datasets for deeper insights
- Encourage detailed reviews to supplement positive but neutral review trends
Approach:
To answer Turtle Games’ key business questions, I applied a multi-method data analysis strategy combining both Python (Pandas, Scikit-learn, Matplotlib, Seaborn, TextBlob) and R. Key steps included:
- Data Cleaning & Preparation: Removed irrelevant variables, handled missing values, encoded categorical fields (like gender and education), and transformed skewed variables such as loyalty scores.
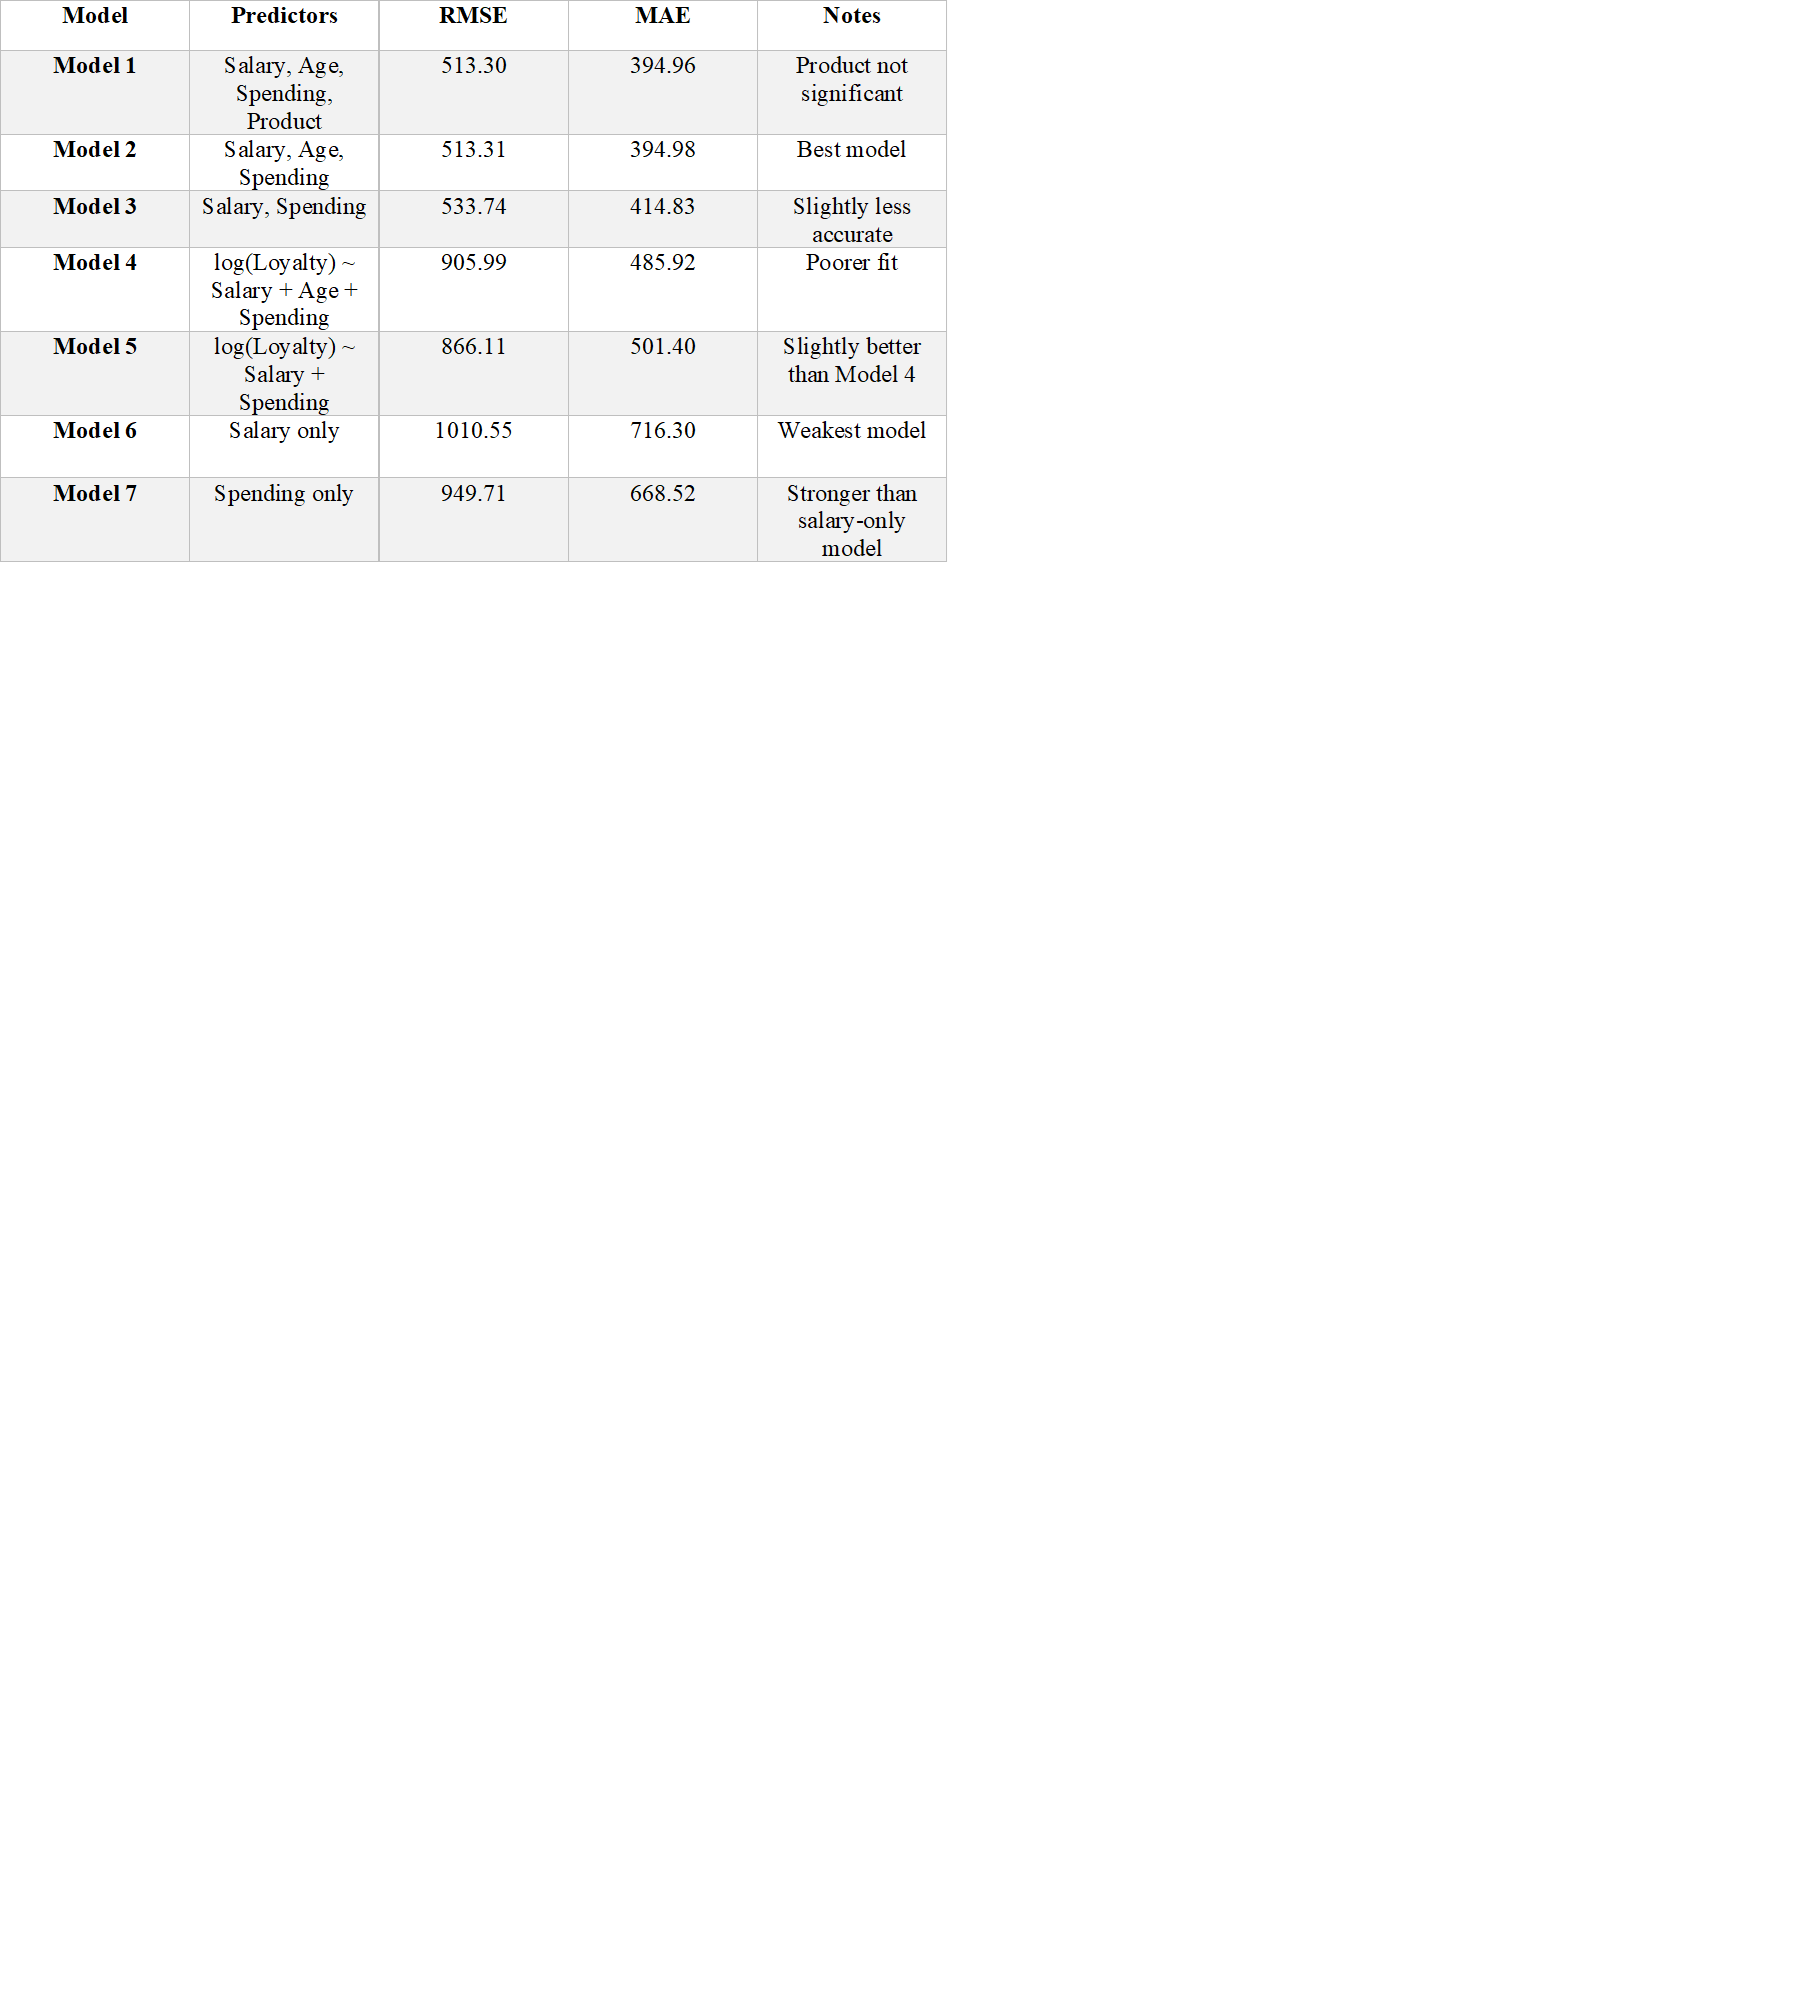
- Regression Modelling (R): Tested multiple linear models to predict loyalty points. The most accurate and interpretable model was the one with Salary + Age + Spending.
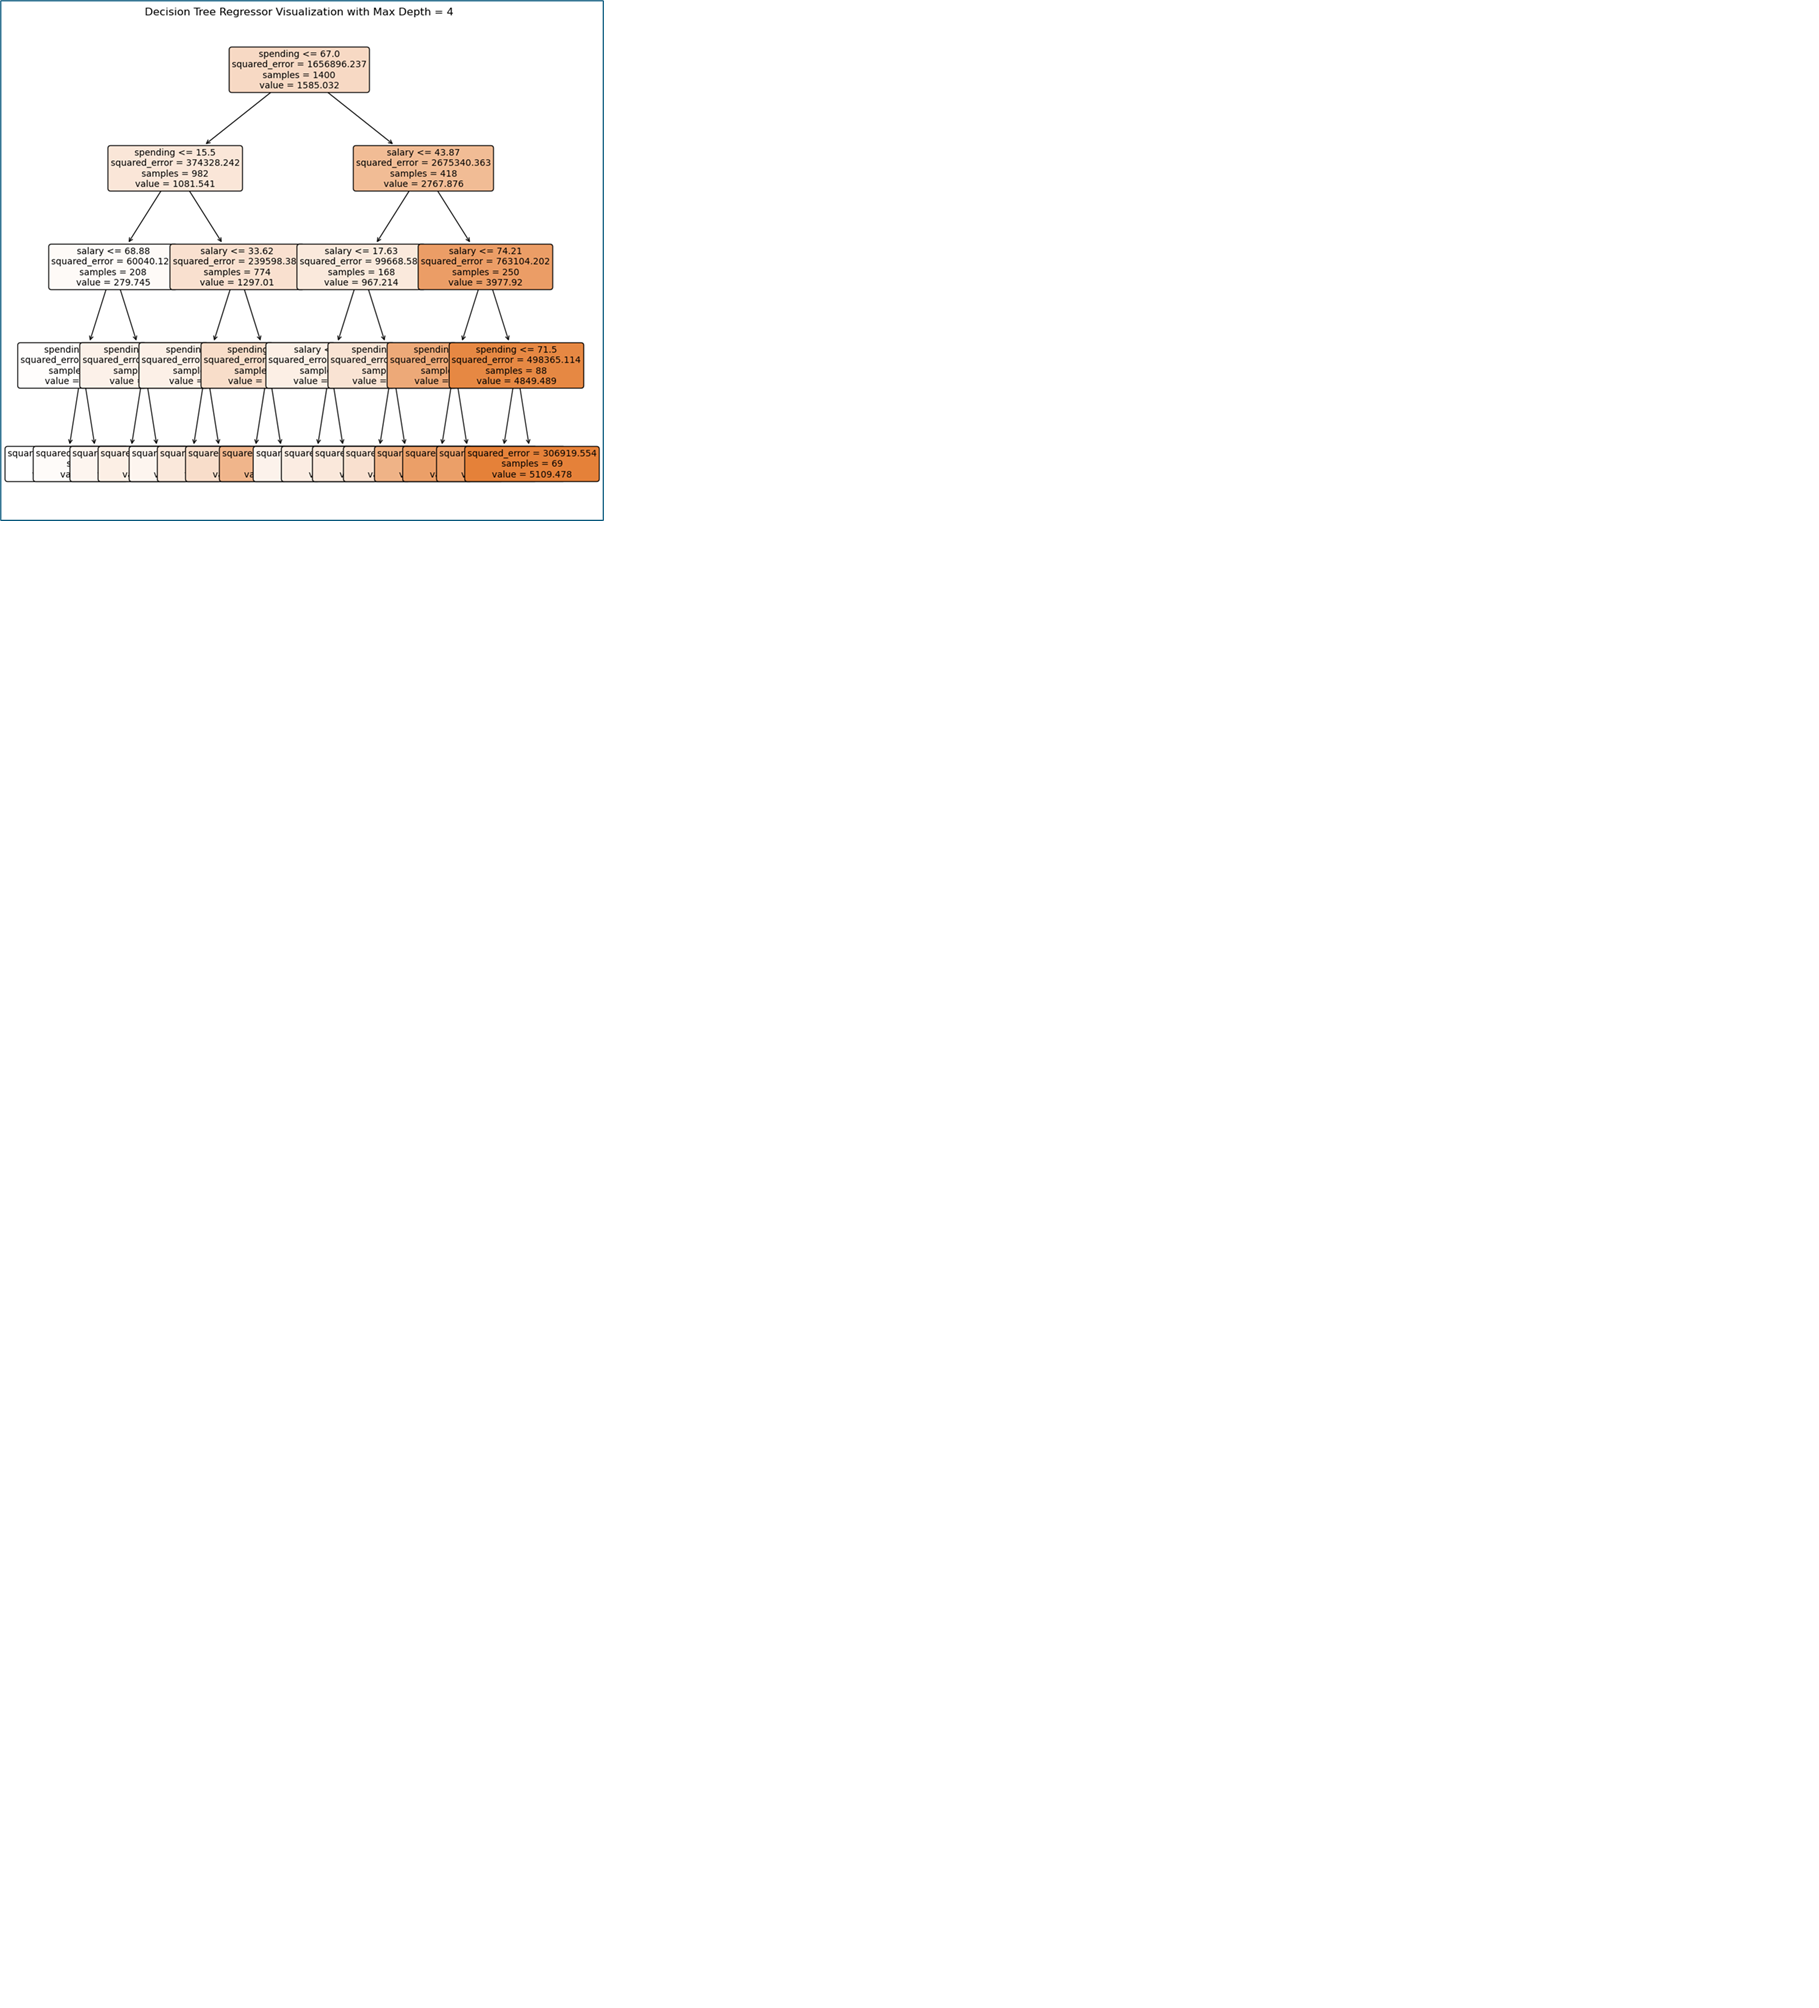
- Decision Tree Regression (Python): Built and pruned Decision Trees mRegressor models to visualise loyalty drivers. Spending and Salary emerged as the most influential predictors.
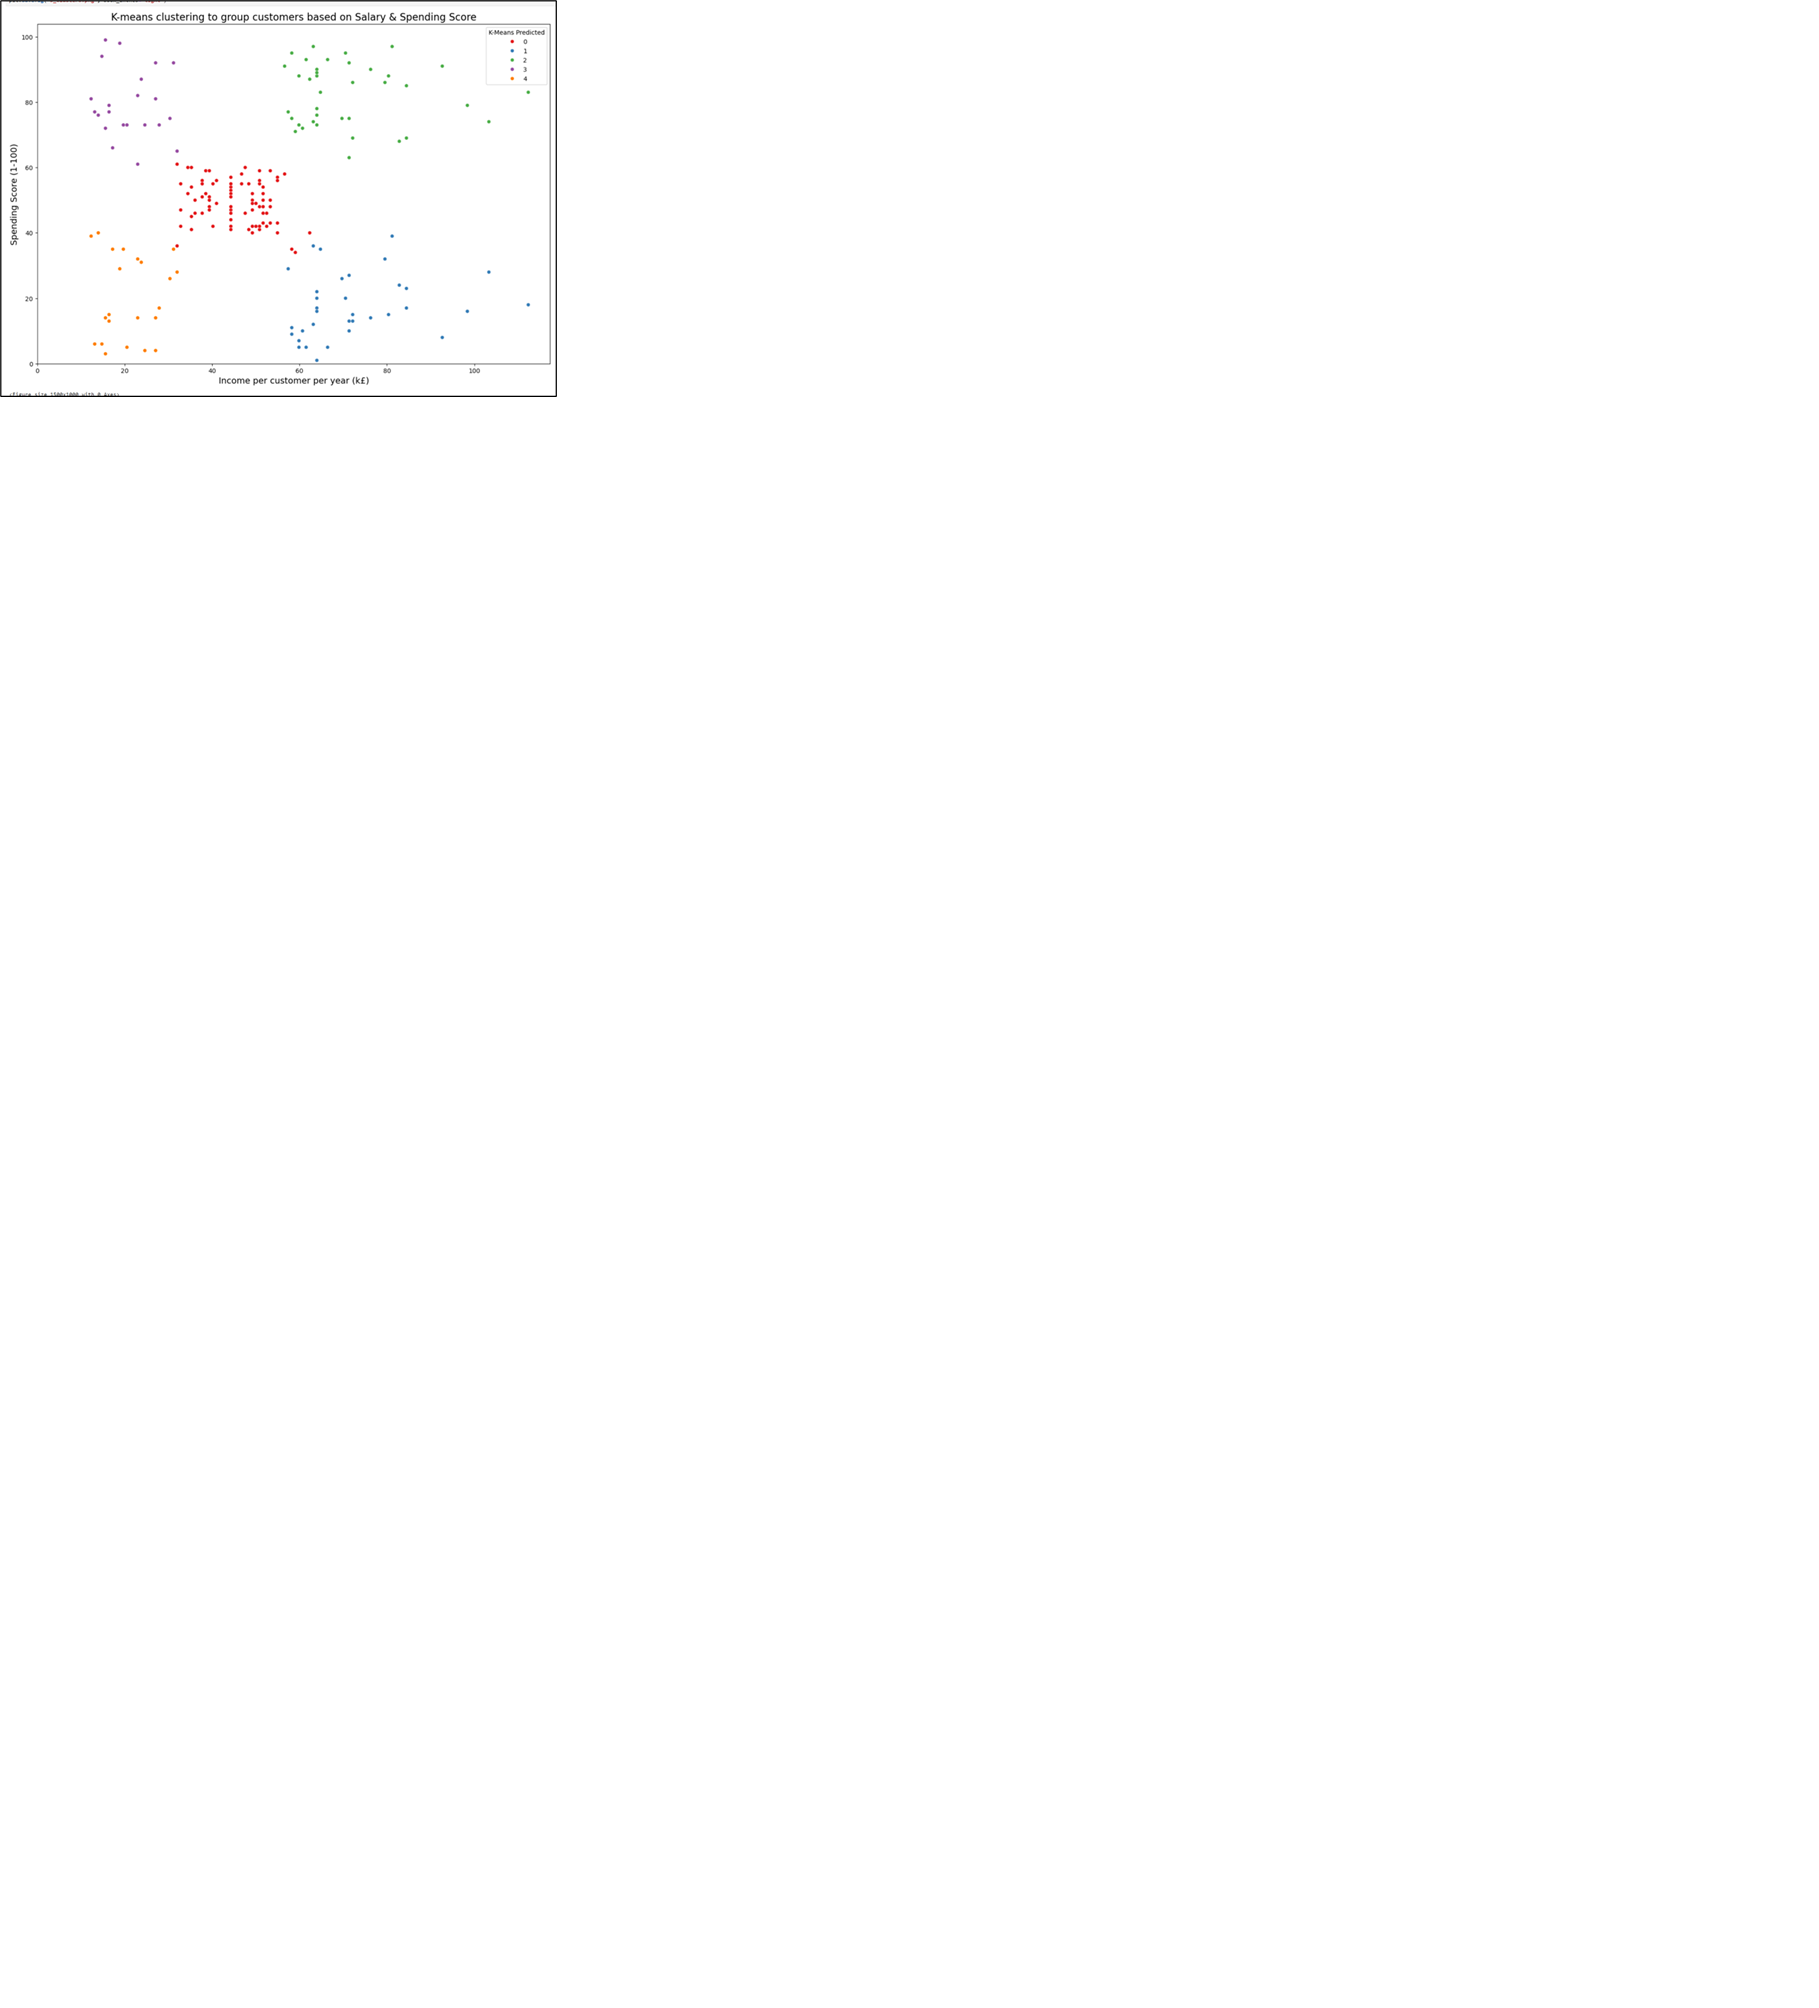
- K-Means Clustering: Segmented customers into 5 distinct groups based on income and spending behaviour to support targeted marketing.
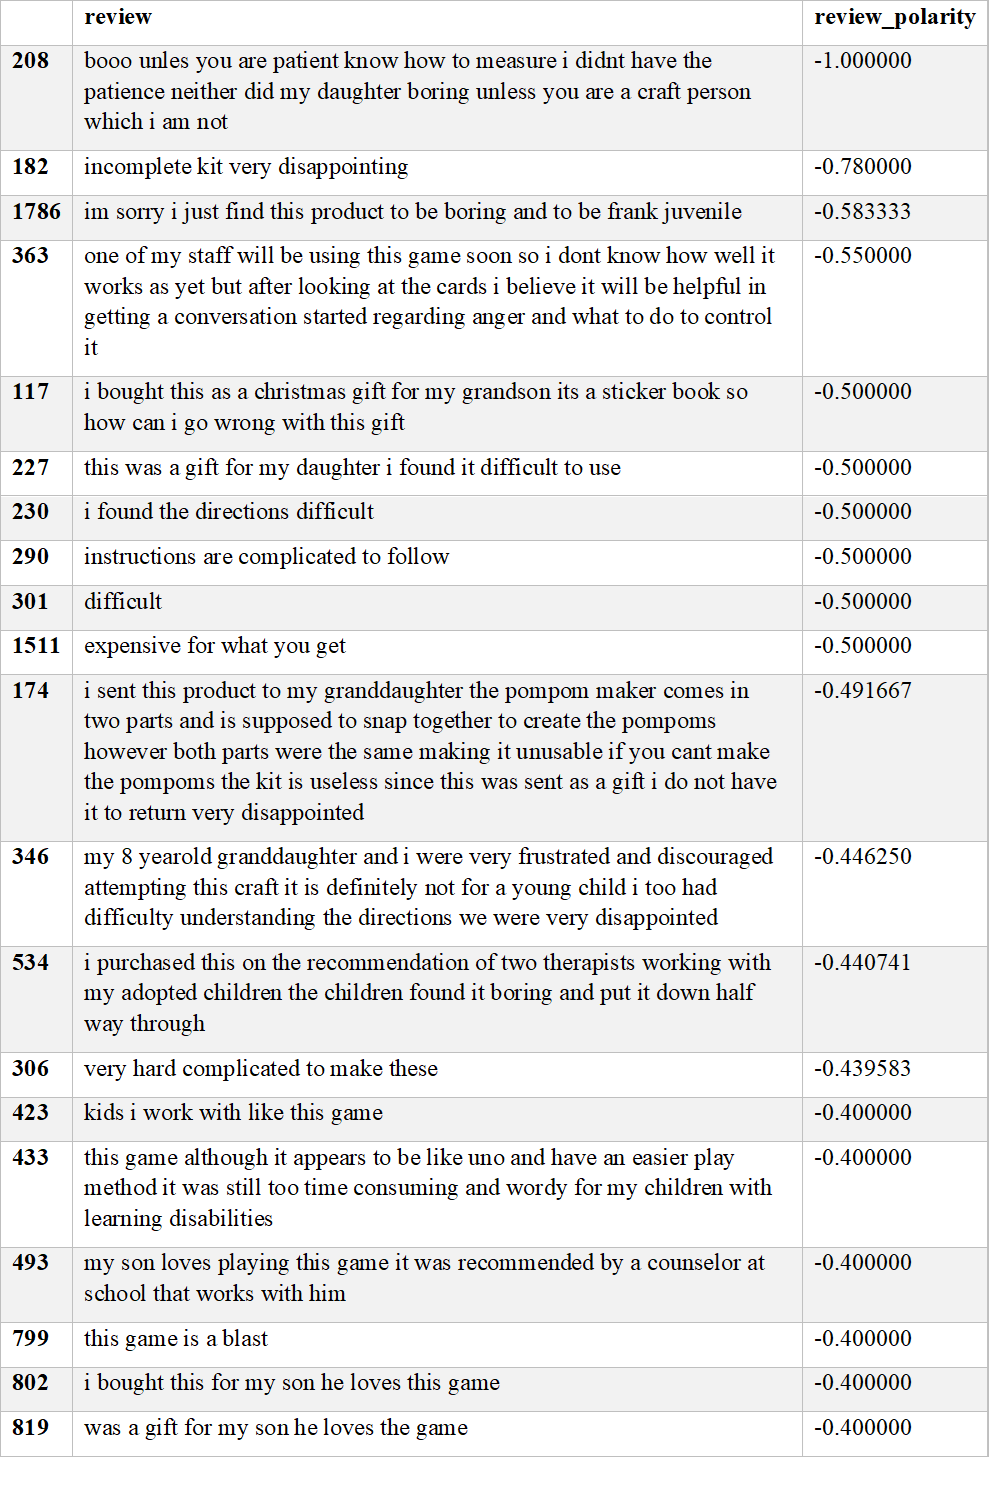
- Sentiment Analysis: Used TextBlob to analyse the review text. Most reviews were neutral to positive, highlighting general satisfaction and areas to improve user experience.
Insights Summary:
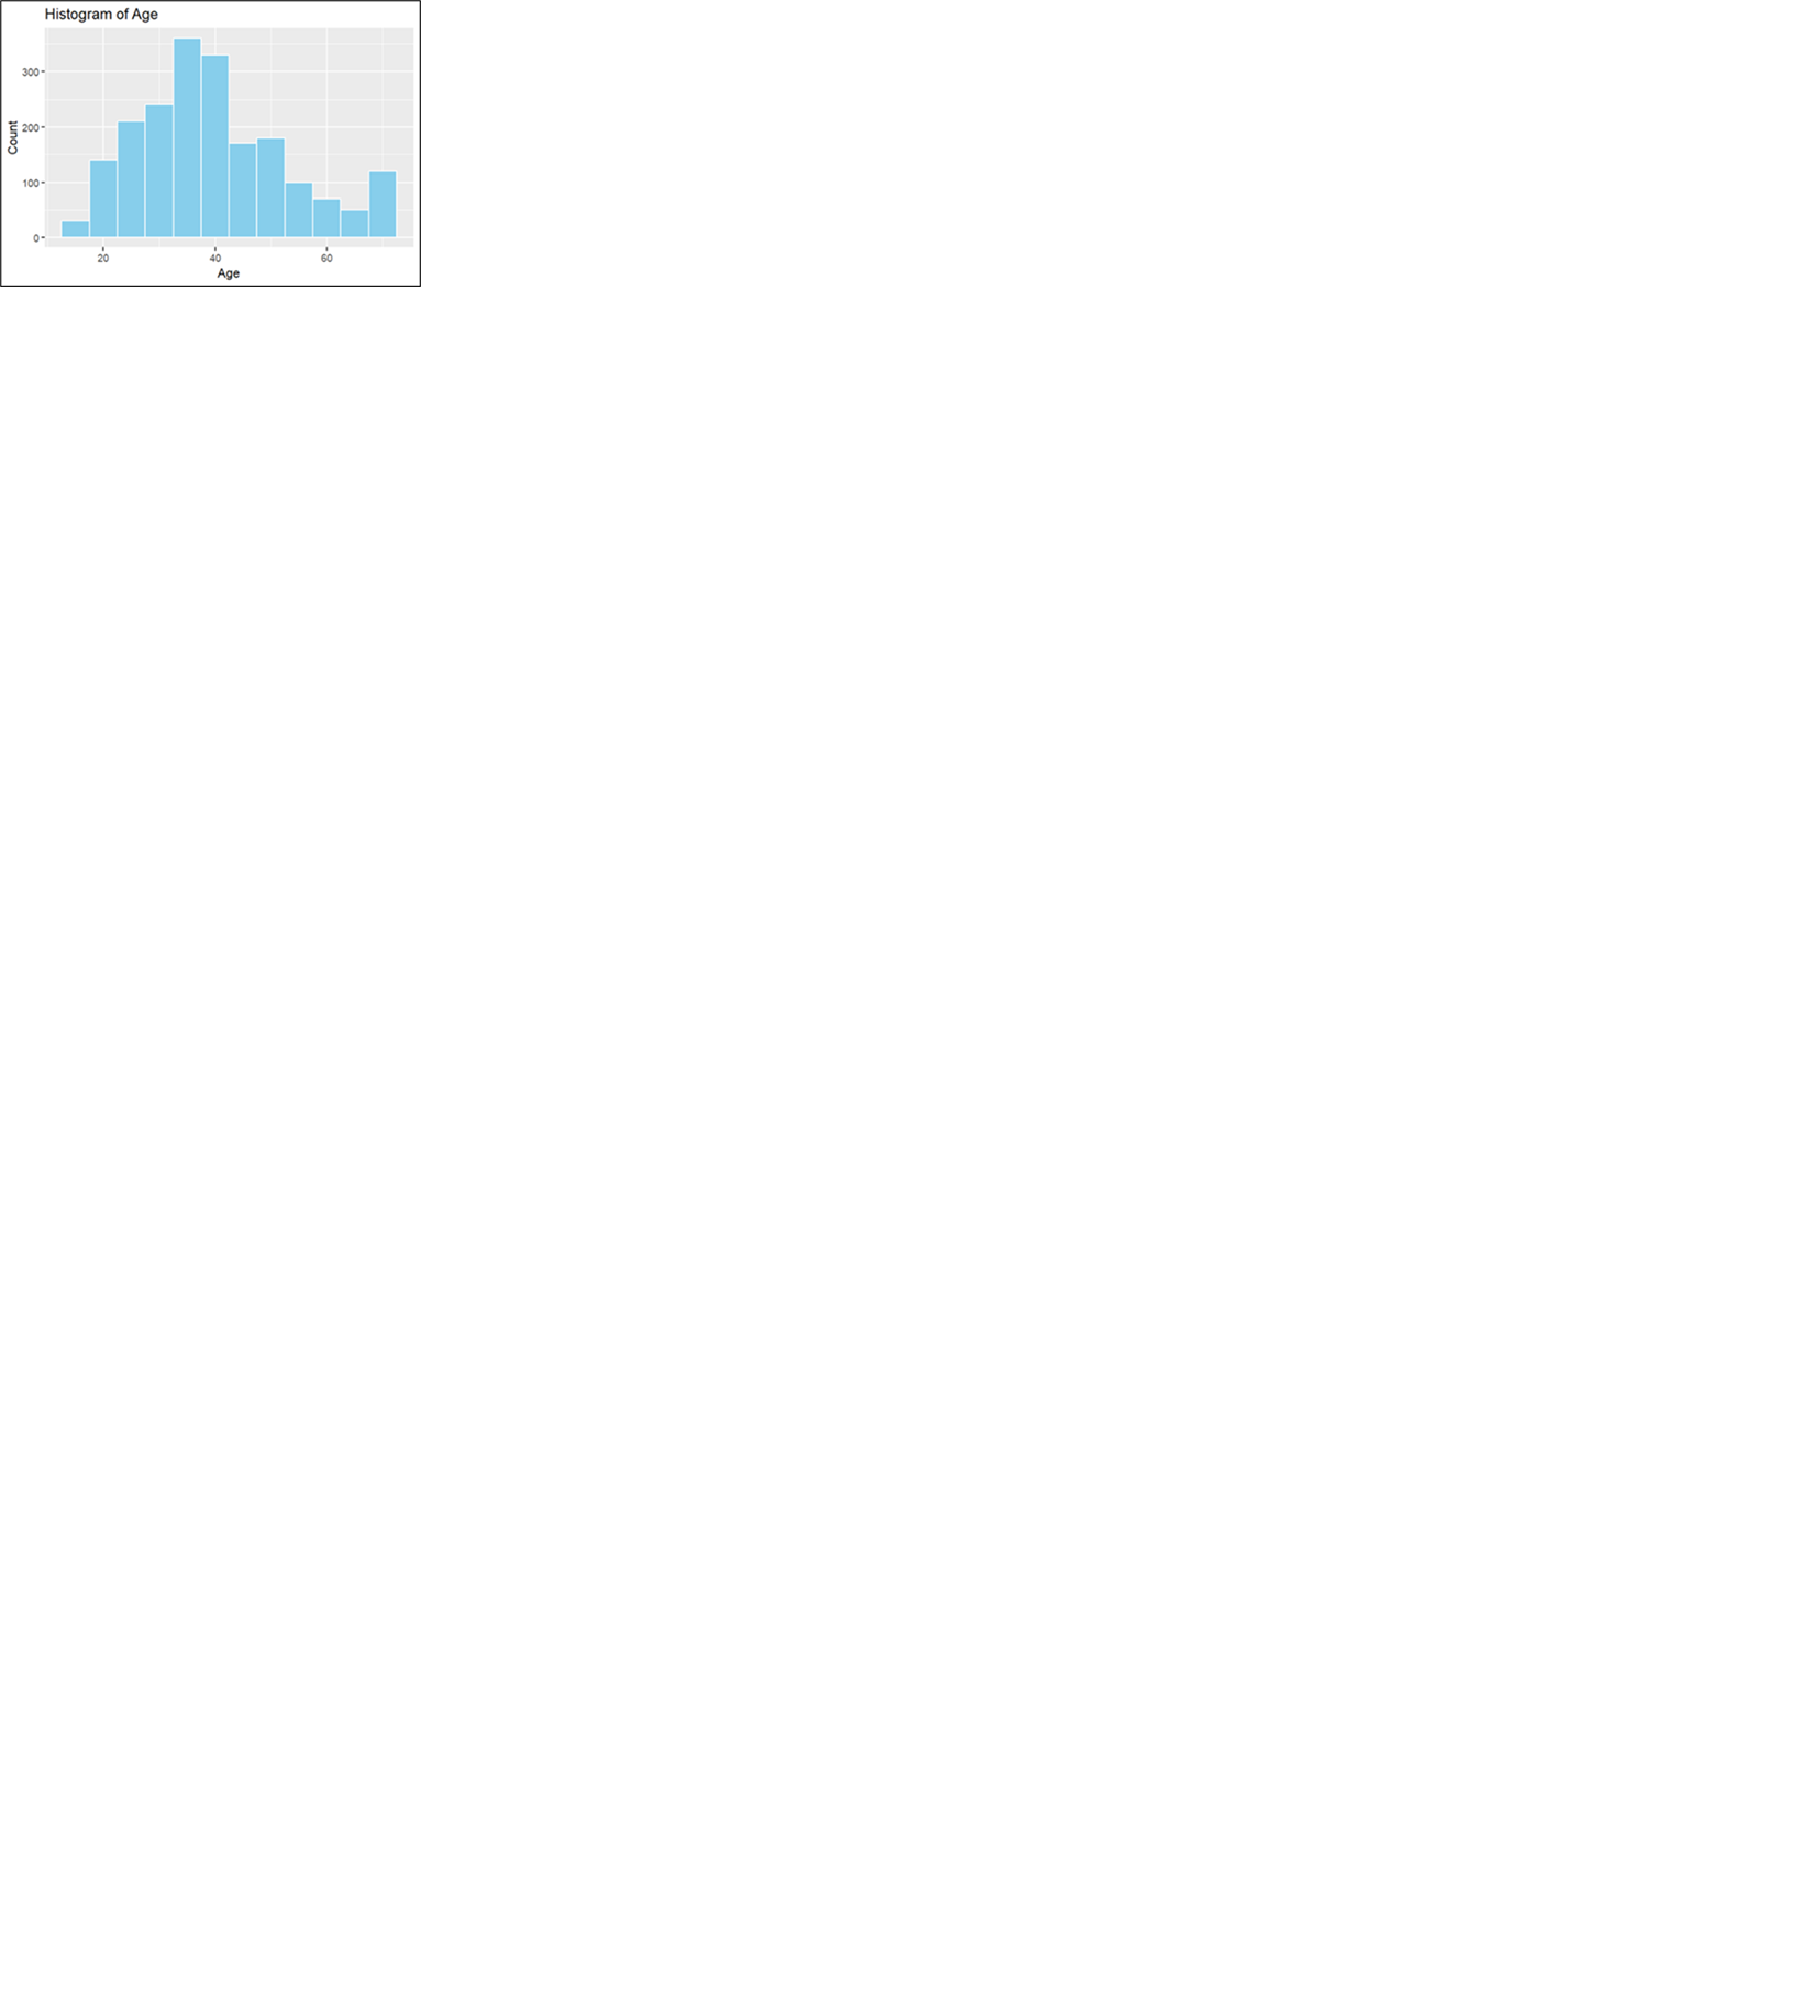
- Loyalty peaked among customers aged 32–34, and those with high salary and spending.
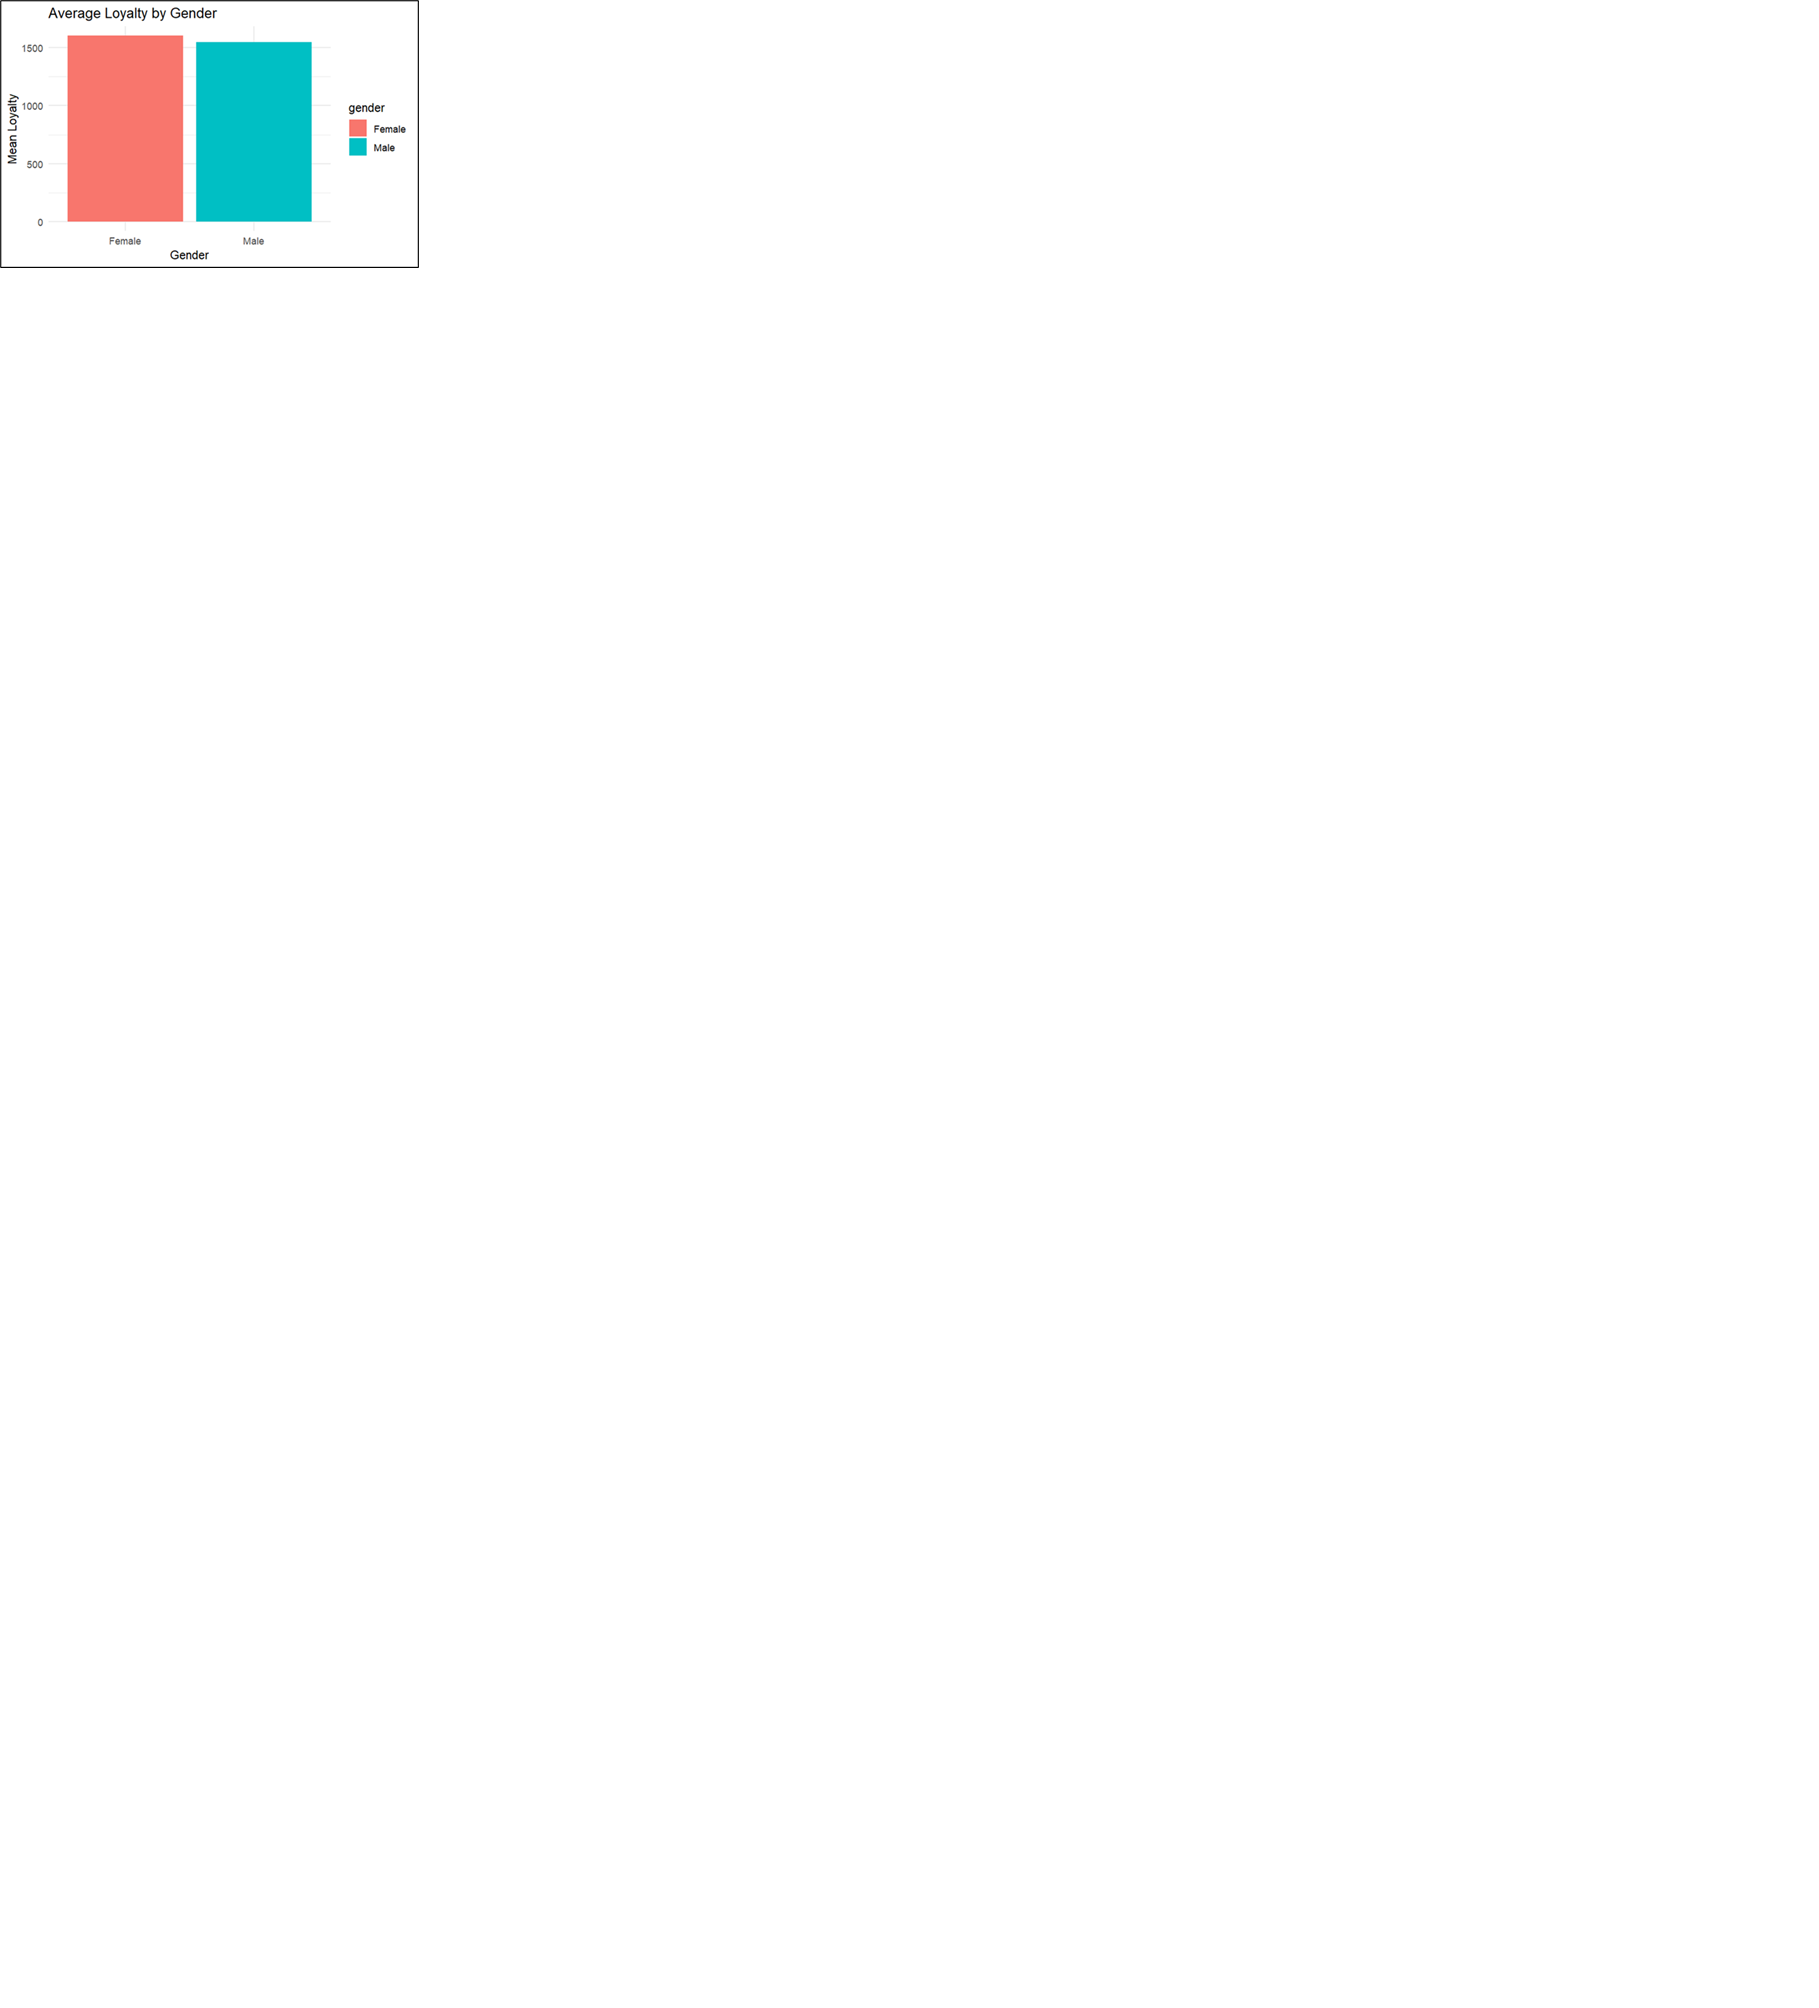
- Female and Basic-Education customers showed slightly higher loyalty.
- Spending and Salary were the strongest loyalty predictors; Product offered limited insight.
- Five customer cluster swere identified via K-Means segmentation, each with unique income–spending traits.
- Customers in Cluster 2 (high income & high spenders) were ideal for premium targeting.
-
Modelling Insights:
Best regression model was the one with: Salary + Age + Spending (RMSE: 513, MAE: 395).
- Top decision tree model was the one with Spending, Salary, Age (R²: 0.9961, MAE: 26).
-
Sentiment Insights
Reviews were largely neutral to positive. Most common words were 'fun', 'game', 'great', and 'love'.

- Negative reviews highlight usability issues, product quality and unclear instructions.
For a complete picture, feel free to look at my report. Click on the GitHub icon to see my complete Python and R codes.